
Key Takeaways:
- Free technical analysis tools vary widely. Some are designed for chart customization, while others focus on screening, market breadth, or automated interpretation.
- StockTA turns multiple indicators into clear short-, mid-, and long-term technical summaries without requiring paid subscription. Registration is free.
- TradingView is a strong choice for interactive charting, while FINVIZ and Barchart are useful for screening large groups of stocks.
- No technical signal is conclusive. Investors should compare timeframes, confirm signals, and use technical analysis alongside broader due diligence.
Technical analysis can be as simple as checking whether a stock is trading above its moving average or as detailed as comparing momentum, volume, volatility, candlestick patterns, and support and resistance across multiple timeframes.
The challenge is not finding indicators. It is finding a platform that presents the right information clearly without putting its most useful features behind a subscription.
Technical analysis studies market-generated data to estimate the probable future direction of prices. It deals in probabilities, not guarantees. The best platform, therefore, is not necessarily the one with the most indicators. It is the one that helps you interpret relevant data efficiently and apply it consistently.
The following seven free stock technical analysis tools cover different needs, from automated trend summaries and stock screening to customizable charts and market breadth analysis.
Free Stock Technical Analysis Tools at a Glance
| Tool | Best for | Notable free features | Main limitation |
| StockTA | Fast, automated technical interpretation | Multi-timeframe summaries, support and resistance, indicators, candlestick recognition, technical screeners | Less manual chart customization than advanced charting platforms |
| TradingView | Interactive charts and customization | Drawing tools, community indicators, watchlist, screeners, two indicators per chart | Free plan includes ads and tighter chart and indicator limits |
| FINVIZ | Visual market screening | Stock screener, heatmaps, charts, technical filters, preset signals | Advanced real-time tools and customization require Elite |
| StockCharts | Classical charting and market breadth | SharpCharts, Point & Figure charts, GalleryView, CandleGlance, market dashboards | Saving, advanced scans, and alerts require membership |
| Investing.com | Multi-asset technical snapshots | Technical summaries, moving averages, indicators, pivot points, multiple timeframes | Interface can feel crowded, and some personalization requires an account |
| Barchart | Detailed stock screening | More than 150 screener data points, sample screeners, FlipCharts, watchlists | Some data is delayed, and advanced alerts require a paid plan |
| Yahoo Finance | Combining charts with company research | Interactive charts, indicators, drawing tools, news, fundamentals, stock screener | Technical workflow is less specialized than dedicated charting platforms |
1. StockTA: Best for Automated Technical Interpretation
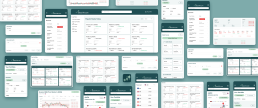
StockTA is designed for investors who want technical information without having to configure every chart or calculate each level manually. Enter a supported stock or ETF ticker, and the platform automatically generates a technical overview.
Its Technical Summary consolidates indicator data into short-, mid-, and long-term bullish or bearish readings. The platform also calculates primary, secondary, and tertiary support and resistance levels, identifies candlestick patterns, and displays commonly used indicators such as RSI, MACD, stochastic oscillators, moving averages, and volume trends.
StockTA also includes preconfigured technical screeners for conditions such as:
- Overbought and oversold readings
- Golden crosses
- Volume breakouts
- Bullish technical patterns
- Candlestick pattern matches
This automated approach is StockTA’s main differentiator. Many platforms give traders the charting components but leave them to draw levels and interpret several indicators individually. StockTA processes those inputs and presents a more digestible view immediately.
The platform is fully ad-supported and accessible by registering for a free account. It does not require a paid subscription or software installation and has no restrictive ticker-search limit. It covers tens of thousands of securities across major exchanges, including the NYSE, Nasdaq, AMEX, TSX, and TSX Venture Exchange.
StockTA was founded in 1999 and is being modernized with an upgraded interface, user accounts, saved preferences and watchlists, and expanded educational content through the StockTA Podcast. Planned development also includes crypto coverage and additional premium stock-screening features, while its core tools remain freely accessible.
“When choosing a technical analysis platform, traders should look for tools that cut through market noise and deliver clear, objective signals without requiring hours of manual charting. StockTA simplifies research by instantly processing complex price data, support/resistance levels, and indicator trends into clear actionable insights, helping traders spend less time drawing lines and more time making informed decisions.”
— Kevin Steuer, Managing Partner of StockTA.com
Best for: Beginners, swing traders, and time-constrained investors who want a fast technical read before conducting deeper research.
What to consider: StockTA emphasizes automated interpretation. Traders who want extensive drawing tools, custom scripts, or highly personalized chart layouts may prefer to use it alongside a more customizable charting platform.
2. TradingView: Best for Customizable Interactive Charts
TradingView is one of the most flexible options for traders who prefer to work directly with charts. Its browser, desktop, and mobile platforms provide multiple chart types, a large indicator library, screeners, drawing tools, watchlists, and a community where users publish market ideas and custom scripts.
TradingView’s free Basic plan is permanent and does not require a credit card. According to its current plan comparison, it includes one chart per tab, one saved chart layout, two indicators per chart, a 30-symbol watchlist, and access to historical daily data. Users can also explore its drawing tools and Pine Script environment.
Best for: Traders who value hands-on charting, custom indicators, and an active market community.
What to consider: The free plan includes advertising and limits how many indicators and charts can be used at once. The platform’s depth can also create a steeper learning curve for beginners who want a quick interpretation rather than a blank analytical canvas.
3. FINVIZ: Best for Visual Stock Screening
FINVIZ is particularly useful for moving from the broad market to a focused list of potential setups. Its free stock screener lets users filter companies by descriptive, fundamental, and technical criteria. Traders can screen for moving-average relationships, performance, volatility, relative volume, chart patterns, and other conditions.
FINVIZ is also known for its market heatmaps, which make it easy to see how sectors, industries, and individual stocks are performing at a glance. This visual approach is helpful for spotting where momentum or weakness is concentrated before opening individual charts.
Best for: Traders who want to scan the U.S. market quickly and identify candidates for further analysis.
What to consider: The free version is supported by ads and does not include the full real-time, customization, alerting, and export capabilities of FINVIZ Elite. The Elite plan is currently listed at $39.50 per month when billed monthly after its trial.
4. StockCharts: Best for Classical Charting and Market Breadth
StockCharts has long focused on chart-based market analysis. Its free tools include SharpCharts, an interactive Advanced Charting Platform, Point & Figure charts, Symbol Summary, seasonality charts, GalleryView, and CandleGlance.
GalleryView displays one security across several timeframes, while CandleGlance places multiple mini-charts side by side. These formats can help traders compare short-, intermediate-, and long-term conditions or review several securities without opening them individually.
StockCharts also offers a detailed Market Summary dashboard covering major indexes, U.S. sectors, breadth, sentiment, volatility, intermarket relationships, and selected economic indicators.
Best for: Investors who use classical charting methods or want to study market breadth, sector leadership, and longer-term trends.
What to consider: Free users can access a useful set of charts, but saving charts, running custom scans, and setting automatic alerts require a paid membership. Paid plans begin at $19.95 per month.
5. Investing.com: Best for Multi-Asset Technical Snapshots
Investing.com’s technical analysis hub covers more than stocks. It brings together technical readings for indexes, futures, commodities, currencies, and other instruments, making it useful for traders who monitor several asset classes.
Its Technical Summary combines moving averages and indicators into buy, sell, or neutral readings across multiple timeframes. Users can also review technical indicators, candlestick patterns, and pivot points.
Best for: Investors who want quick technical readings across global markets and several asset classes.
What to consider: The site contains a large amount of news, analysis, advertising, and promotional content, so the interface may feel crowded. Some customized views and saved settings also require an account.
6. Barchart: Best for Detailed Screening and Signal Discovery
Barchart combines market data, charts, screeners, performance lists, heatmaps, and technical trading signals. Its free Stocks Screener supports more than 150 data points and lets users filter securities using technical, fundamental, performance, and descriptive criteria.
The screener also provides sample templates, shareable results, downloadable data, and FlipCharts for paging through the charts behind a result set. A free account can save one custom screener, while paid memberships expand saving and alert options.
Barchart supports U.S., Canadian, U.K., Australian, and European market views. Its site notes that U.S. stock data is generally delayed by 15 to 20 minutes, although Cboe BZX data is real time.
Best for: Investors who want granular screening criteria and a structured way to move from a large universe to a technical watchlist.
What to consider: Data timing varies by market, and automated screener emails and some advanced workflow features require a paid membership.

7. Yahoo Finance: Best for Technical Charts in a Broader Research Workflow
Yahoo Finance is not a technical-analysis-only platform, but its familiarity and breadth make it a practical starting point. An interactive stock chart can display indicators, technical overlays, corporate events, comparisons, and drawing tools alongside price and volume.
Yahoo Finance also provides company profiles, financial statements, news, earnings information, analyst estimates, and portfolio tools. Its free equity screener offers more than 150 criteria, helping users connect chart observations with company and market context.
Best for: Investors who want technical charts, company information, and market news in one familiar place.
What to consider: The technical workflow is less specialized than StockTA, TradingView, or StockCharts. Traders who need automated pattern interpretation or advanced chart management may outgrow it.
How to Choose the Right Free Technical Analysis Tool
There is no single best tool for every investor. Start with the job you want the platform to perform:
- For an immediate interpretation: Use StockTA to review trend direction, support and resistance, candlestick patterns, and multiple timeframes without configuring a chart.
- For manual chart work: Use TradingView for customizable charts, drawing tools, and community-built indicators.
- For finding possible setups: Use FINVIZ or Barchart to screen a large market by technical conditions.
- For market breadth and classical methods: Use StockCharts to compare sectors, indexes, and several timeframes.
- For cross-asset monitoring: Use Investing.com to compare technical conditions beyond equities.
- For an all-in-one research starting point: Use Yahoo Finance to place charts beside news and company fundamentals.
Many investors will benefit from using two complementary platforms. A screener can identify a candidate, an automated summary can make its technical condition easier to understand, and a customizable chart can help verify the setup in more detail.

Free Does Not Mean Risk-Free
Technical indicators summarize historical price, volume, and market behavior. They do not know what will happen next. Signals can conflict across timeframes, breakouts can fail, and low-volume securities can produce noisy or misleading patterns.
FINRA notes that momentum investors use indicators based on price and volume to assess whether a trend may continue, but identifying market peaks and troughs remains difficult.
Investors should treat technical analysis as one input, not a substitute for understanding a company, reviewing its disclosures, and managing risk. The SEC’s Investor.gov provides guidance on using company filings for investment research, while FINRA offers additional due-diligence considerations.
Start with a Clearer Technical View
The best free stock technical analysis tool is the one that fits your process and helps you evaluate data consistently.
For traders who want immediate, multi-timeframe interpretation without a paywall or complicated setup, explore StockTA and enter a ticker to review its technical summary, support and resistance levels, key indicators, candlestick patterns, and related screener signals.
Disclaimer: The information and content provided in Global One Media’s blog are for general informational purposes only and do not constitute financial, investment, trading, legal, tax, or any other form of advice or recommendation. The content is intended solely for distribution on Global One Media’s network and is based on information available at the time of writing. Readers are strongly encouraged to seek professional financial advice before making any investment decisions.